
How to create ontology
Before you begin
Section titled “Before you begin”Ontology works best when you know:
- The business concepts (entities) you want to model, such as customers, orders or shipments.
- Which data source holds the data for each concept.
- How those concepts relate to each other, for example Customer places Order.
Step 1: Create a new ontology
Section titled “Step 1: Create a new ontology”- From the main menu, click Ontology.
- Click the New Ontology button. The New ontology window opens, where you can start from a template or begin with a blank canvas.
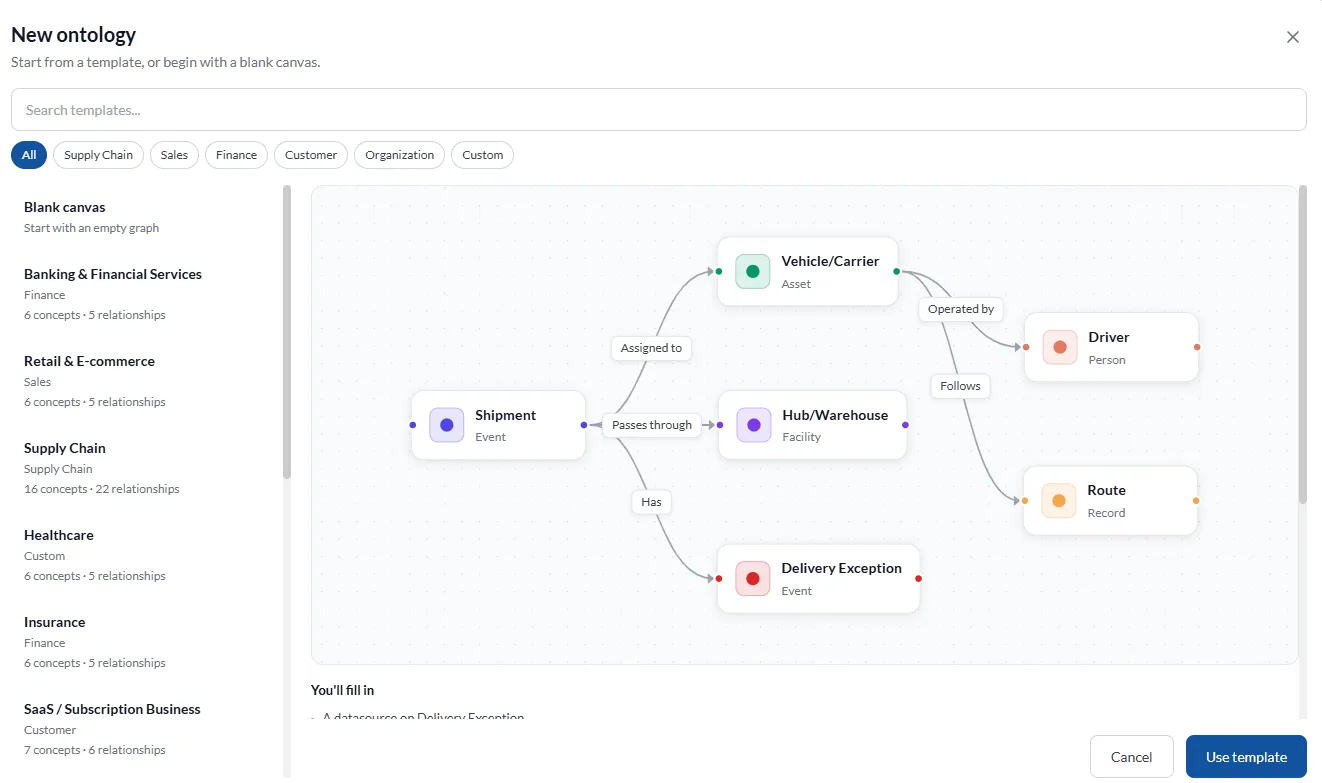
Choose one of the two options below.
Option A: Use a template (recommended)
Section titled “Option A: Use a template (recommended)”Using a template is the easiest way to get started, because it gives you a ready-made set of nodes and relationships that you can then adapt.
- Browse the template list, or use Search templates to find one.
- Use the category filters to narrow the list: All, Supply Chain, Sales, Finance, Customer, Organization and Custom.
- Click a template to see a preview of its nodes and relationships. Each template also shows how many concepts (nodes) and relationships it contains.
- Review the You’ll fill in section below the preview. It lists what you need to supply, such as a data source for a particular node.
- Click Use template.
Templates include industry and business-function examples such as Banking & Financial Services, Retail & E-commerce, Supply Chain, Healthcare, Insurance and SaaS / Subscription Business.
Option B: Start with a blank canvas
Section titled “Option B: Start with a blank canvas”- In the template list, select Blank canvas (start with an empty graph).
- Enter a name and a description for your ontology.
- Confirm to open the empty canvas.
Step 2: Add nodes
Section titled “Step 2: Add nodes”On the ontology canvas, nodes are the building blocks of your model.
- Click the + New Node button in the top toolbar.
- Enter a name for the node, for example Shipment.
- Enter a description that explains what the node represents and how it should be used.
If you started from a template, the canvas already contains nodes. You can edit them or add more with + New Node.
Step 3: Link a data source to a node
Section titled “Step 3: Link a data source to a node”Each node should be connected to the data that represents it.
- Click the node on the canvas. The Node panel opens on the right-hand side.
- Review or edit the node’s name, type and description. Use the Properties section to add key, value and type properties if needed.
- In the Datasource section, link the data source that supplies the data for this node.
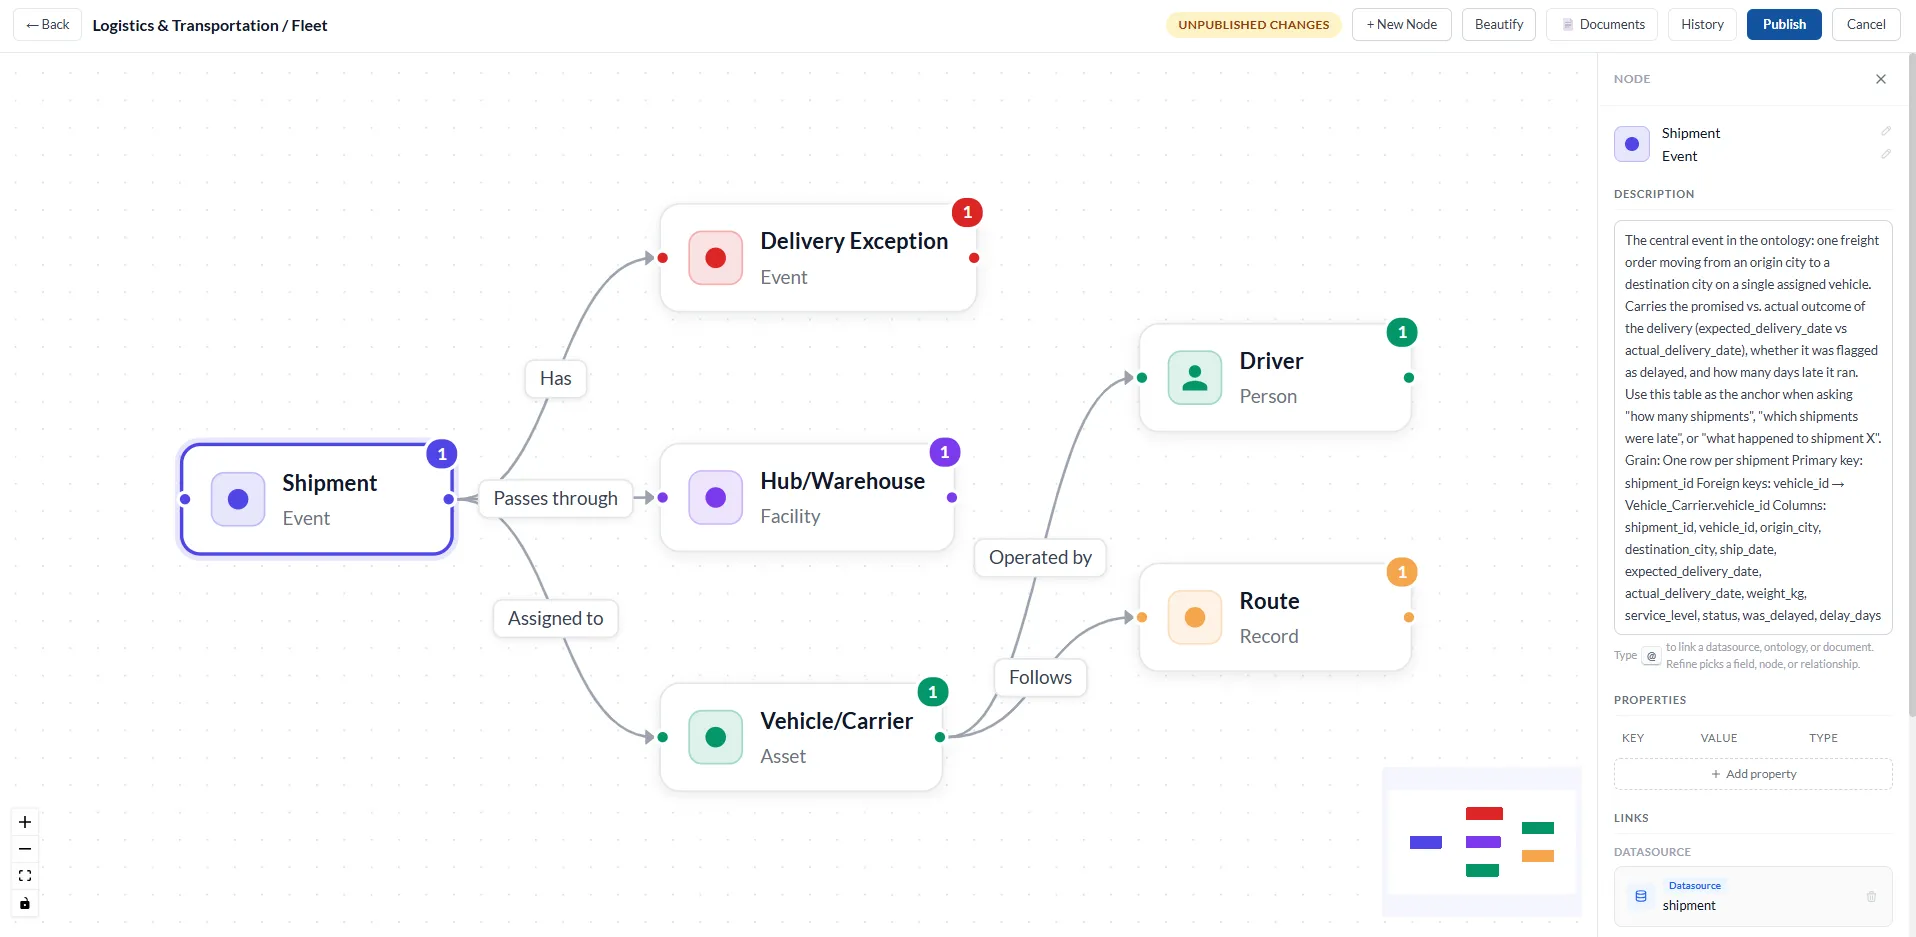
What to write in the description: A detailed description helps people and AI understand the node. For a data-backed node, it is useful to explain what the node represents, what one row means, the key columns, and the kinds of questions it helps answer.
Linking from the description: In the description box, type @ to link a data source, another ontology or a document directly. Use Refine to pick a specific field, node or relationship.
Step 4: Create relationships between nodes
Section titled “Step 4: Create relationships between nodes”Relationships describe how nodes connect, for example Shipment passes through Hub/Warehouse.
- Add a second node using + New Node, and complete its name, description and data source (Steps 2 and 3).
- Drag a connection from one node to the other to create a relationship.
- Click the relationship label on the canvas. The Relationship panel opens on the right-hand side.
- Name the relationship with a short action, such as Has, Assigned to or Operated by, and add a description if helpful.
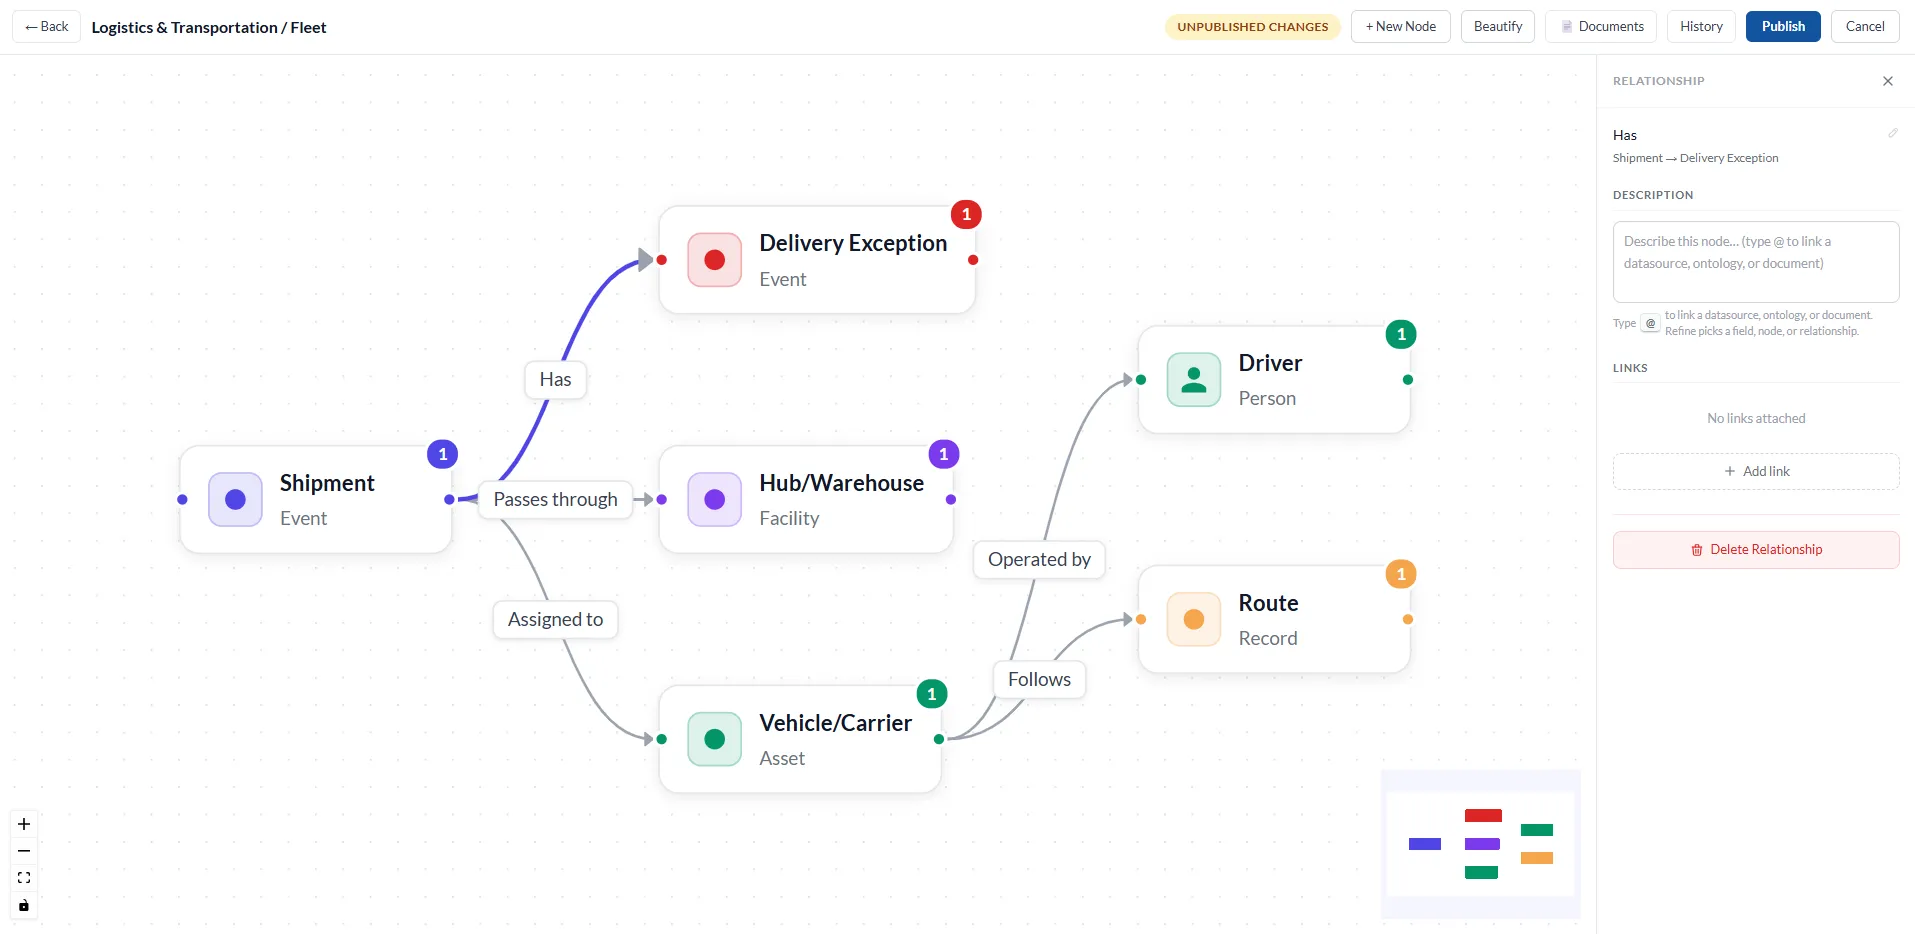
The panel shows the direction of the relationship (for example, Shipment → Delivery Exception). To remove a relationship, click Delete Relationship in the panel.
Repeat Steps 2 to 4 until the ontology reflects the business process you want to model.
Step 5: Add links to nodes and relationships
Section titled “Step 5: Add links to nodes and relationships”Both the Node panel and the Relationship panel have a Links section. Use Add link to connect the node or relationship to:
- A data source
- Another ontology
- A document
To learn how to attach , uploading documents, see .
Step 6: Publish your ontology
Section titled “Step 6: Publish your ontology”While you edit, the toolbar shows an Unpublished changes indicator.
| Button | What it does |
|---|---|
| Back | Returns to the previous screen. |
| + New Node | Adds a new node to the canvas. |
| Beautify | Tidies the layout of the canvas. |
| Documents | Opens the documents associated with the ontology. |
| History | Shows the history of changes. |
| Publish | Publishes your changes. |
| Cancel | Exits without publishing. |
When you are happy with the ontology, click Publish.
- Start from a template and adapt it. It is faster than building from scratch.
- Model concepts first, then link data sources.
- Write clear descriptions. They help teammates and AI understand each node.
- Use short, action-based relationship names such as places, includes and billed through.
- Use Beautify if the canvas becomes crowded.