
Period Comparison
Period Comparison lets you compare a metric across different time periods in the same visualization. Use it to identify trends, measure growth or decline, and compare the current period with an earlier period such as the previous month or previous year.
Period Comparison is supported in:
- Bar charts
- Line charts
- Area charts
- Combination charts
- Tables
- Pivot tables
How Period Comparison works
Section titled “How Period Comparison works”When you add a date or datetime field to an axis, you can enable Period Comparison to compare the measure for each date with the corresponding date in an earlier period.
For example, if your chart shows monthly revenue:
| Month | Current Revenue | Previous Year |
|---|---|---|
| Aug 2021 | €120K | €100K |
| Sep 2021 | €135K | €110K |
| Oct 2021 | €128K | €115K |
In this example,
- August 2021 is compared with August 2020,
- September 2021 with September 2020, and so on.
You can also compare periods such as:
- Current month vs. previous month-
- Current year vs. previous year
- Current period vs. two periods earlier
The comparison period is controlled by the Compare to settings.
Enable Period Comparison
Section titled “Enable Period Comparison”- Create a supported chart and add a date or datetime field to an axis.
- Add the measure you want to compare.
- Open the Period Comparison settings.
- Turn on Compare periods.
- Under Compare to, select the period you want to compare against.
- Select how you want the comparison displayed.
For example, to compare each month with the same month last year:
Compare to → Previous → 1 → Year
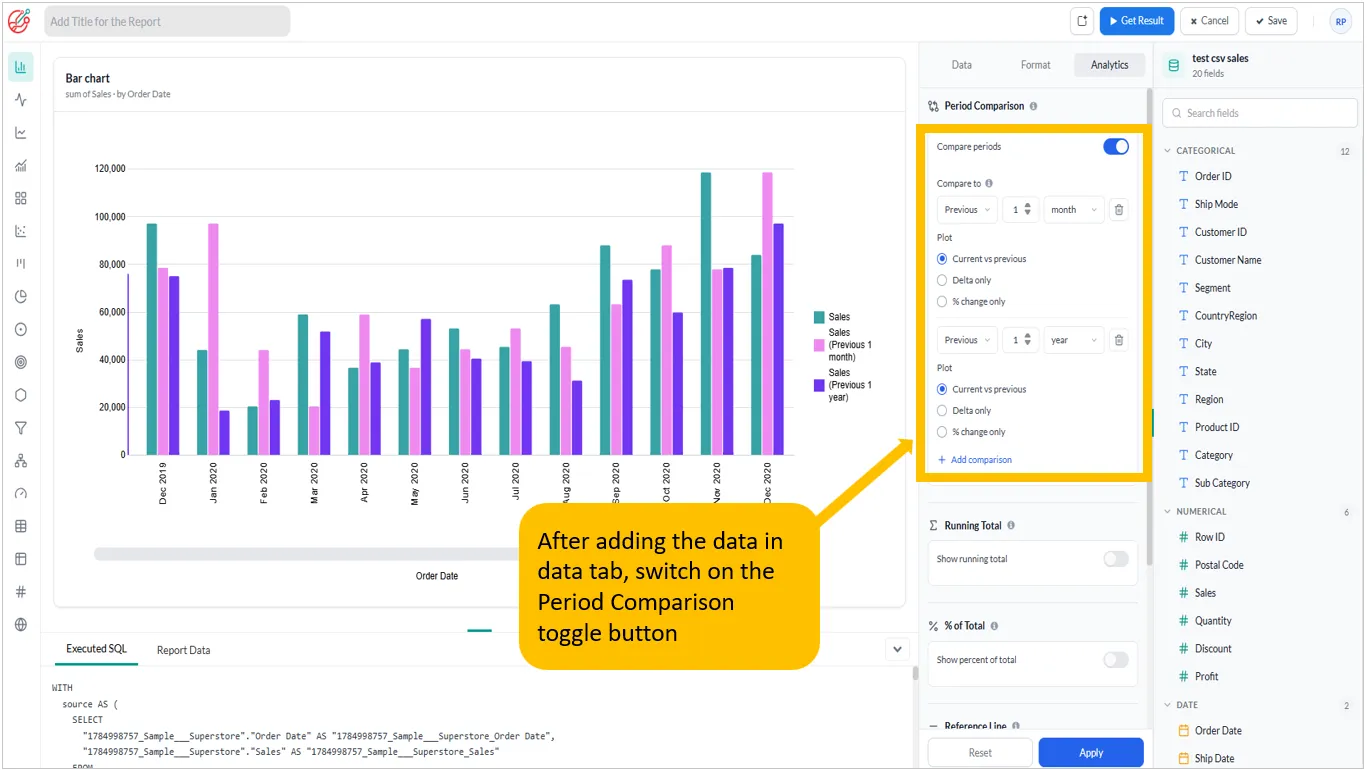
The chart then compares each date on the axis with the corresponding date one year earlier.
Configure a comparison
Section titled “Configure a comparison”The Compare to controls contain three settings:
1. Comparison direction
Section titled “1. Comparison direction”Select Previous to compare the current period with an earlier period.
2. Number of periods
Section titled “2. Number of periods”Specify how many periods to move back.
For example:
- Previous 1 Year --- compares with one year earlier
- Previous 2 Years --- compares with two years earlier
- Previous 1 Month --- compares with one month earlier
- Previous 3 Months --- compares with three months earlier
3. Period
Section titled “3. Period”Select the unit used for the comparison, such as month or year.
The available period units depend on the date field and the chart configuration.
Choose how to display the comparison
Section titled “Choose how to display the comparison”For each comparison, you can choose one of three display options.
Current vs previous
Section titled “Current vs previous”Displays both the current-period value and the comparison-period value.
For example:
Aug 2021: €120K
Aug 2020: €100K
This option is useful when you want to see the actual values for both periods.
Delta only
Section titled “Delta only”Displays the difference between the current and comparison periods.
Formula:
Delta = Current value − Previous value
For example:
Current: €120K
Previous: €100K
Delta: +€20K
A negative delta indicates that the current value is lower than the comparison value.
% change only
Section titled “% change only”Displays the percentage change between the two periods.
Formula:
% change = ((Current value − Previous value) / Previous value) × 100
For example:
Current: €120K
Previous: €100K
% change: +20%
Use this option when the relative change is more useful than the absolute values.
Add multiple period comparisons
Section titled “Add multiple period comparisons”You can add more than one comparison to the same visualization.
Select + Add comparison to add another comparison.
For example, a monthly revenue chart could include:
- Previous 1 Month --- compare with the previous month
- Previous 1 Year --- compare with the same month last year
This lets you analyze both short-term and year-over-year changes in the same view.
Example
Section titled “Example”Suppose your chart is showing revenue for August 2021.
With these comparisons:
Previous 1 Month - August 2021 → July 2021
Previous 1 Year - August 2021 → August 2020
You can therefore compare the same value against multiple historical periods without creating separate charts.
Example: Compare monthly revenue year over year
Section titled “Example: Compare monthly revenue year over year”Suppose you want to see how monthly revenue in 2021 compares with the corresponding months in 2020.
- Add Month to the chart’s date axis.
- Add Revenue as the measure.
- Enable Compare periods.
- Set Compare to to:
- Previous
- 1
- Year
- Select Current vs previous.
The visualization will show each 2021 month alongside its corresponding month from 2020.
For example:
Jan 2021 ↔ Jan 2020
Feb 2021 ↔ Feb 2020
Mar 2021 ↔ Mar 2020
Example: Compare with the previous month
Section titled “Example: Compare with the previous month”You can also use Period Comparison to analyze month-over-month changes.
For a chart showing monthly sales:
- Add the date field to the axis.
- Enable Compare periods.
- Set the comparison to Previous 1 Month.
- Choose Current vs previous, Delta only, or % change only.
If sales were €50,000 in January and €55,000 in February:
- Current vs previous: €55,000 vs €50,000
- Delta only: +€5,000
- % change only: +10%
Period Comparison in tables and pivot tables
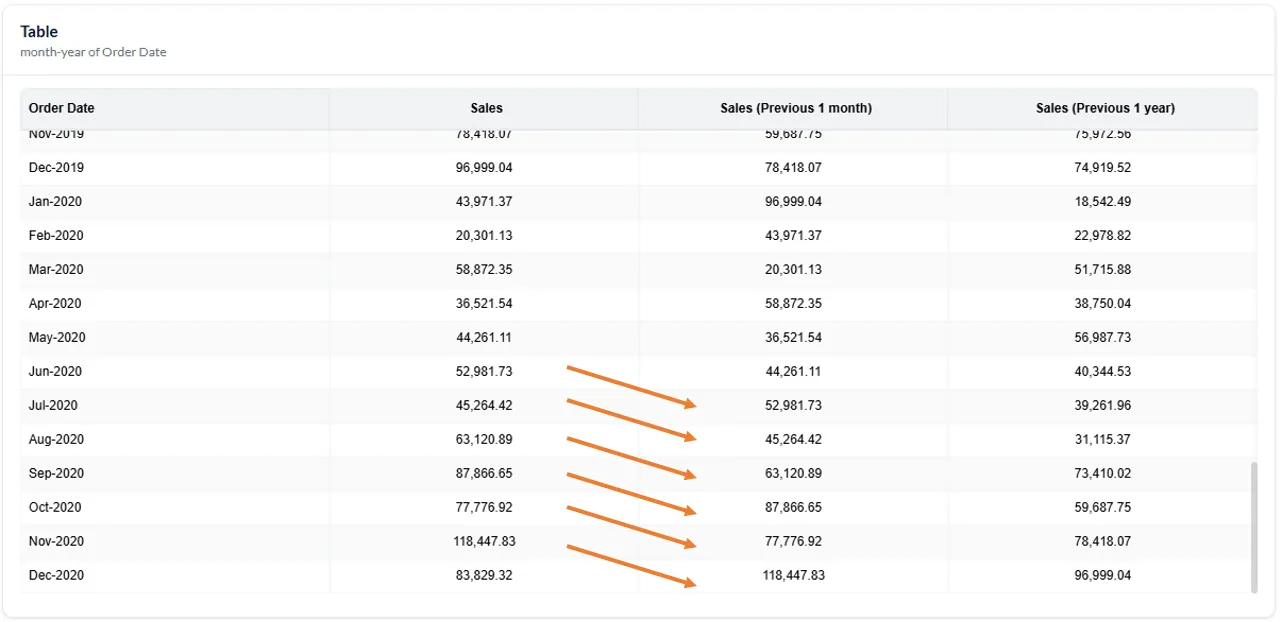
Section titled “Period Comparison in tables and pivot tables”Period Comparison can also be used with Table and Pivot Table visualizations.
This is useful when you want to see the comparison values in a tabular format rather than as bars, lines, or areas.
For example, a table can show:
| Month | Revenue | Previous Year | % Change |
|---|---|---|---|
| Aug 2021 | €120K | €100K | +20% |
| Sep 2021 | €135K | €110K | +22.7% |
| Oct 2021 | €128K | €115K | +11.3% |
The exact layout depends on the visualization and the selected comparison mode.
Tips for using Period Comparison
Section titled “Tips for using Period Comparison”- Use Previous 1 Year for year-over-year analysis.
- Use Previous 1 Month for month-over-month analysis.
- Choose Current vs previous when you need to see the actual values.
- Choose Delta only when the absolute difference is what matters.
- Choose % change only when you want to compare relative growth or decline.
- Add multiple comparisons when you need to examine different historical offsets in the same visualization.
- Make sure a date or datetime field is placed on the axis before enabling Period Comparison.
In summary
Section titled “In summary”Period Comparison provides a quick way to compare the same measure across time. Add a date or datetime field to an axis, enable the feature, select how far back to compare, and choose whether to display the values, the difference, or the percentage change.