
Moving Average
Moving Average smooths fluctuations in a series by calculating the average of a set number of values around each data point. It helps reveal the underlying trend in your data by reducing the effect of short-term increases and decreases.
Moving Average is useful when your data contains noise, seasonality, or short-term fluctuations that make the overall trend difficult to see.
Moving Average is supported in:
- Bar charts
- Line charts
- Area charts
- Combination charts
- Tables
- Pivot tables
Enable Moving Average
Section titled “Enable Moving Average”- Add a measure to your visualization.
- Open the Analytics tab.
- Find Moving Average.
- Turn on Show moving average.
- Configure the number of values to include before and after the current value.
The Moving Average settings include:
- Previous
- Next
- Null if not enough values
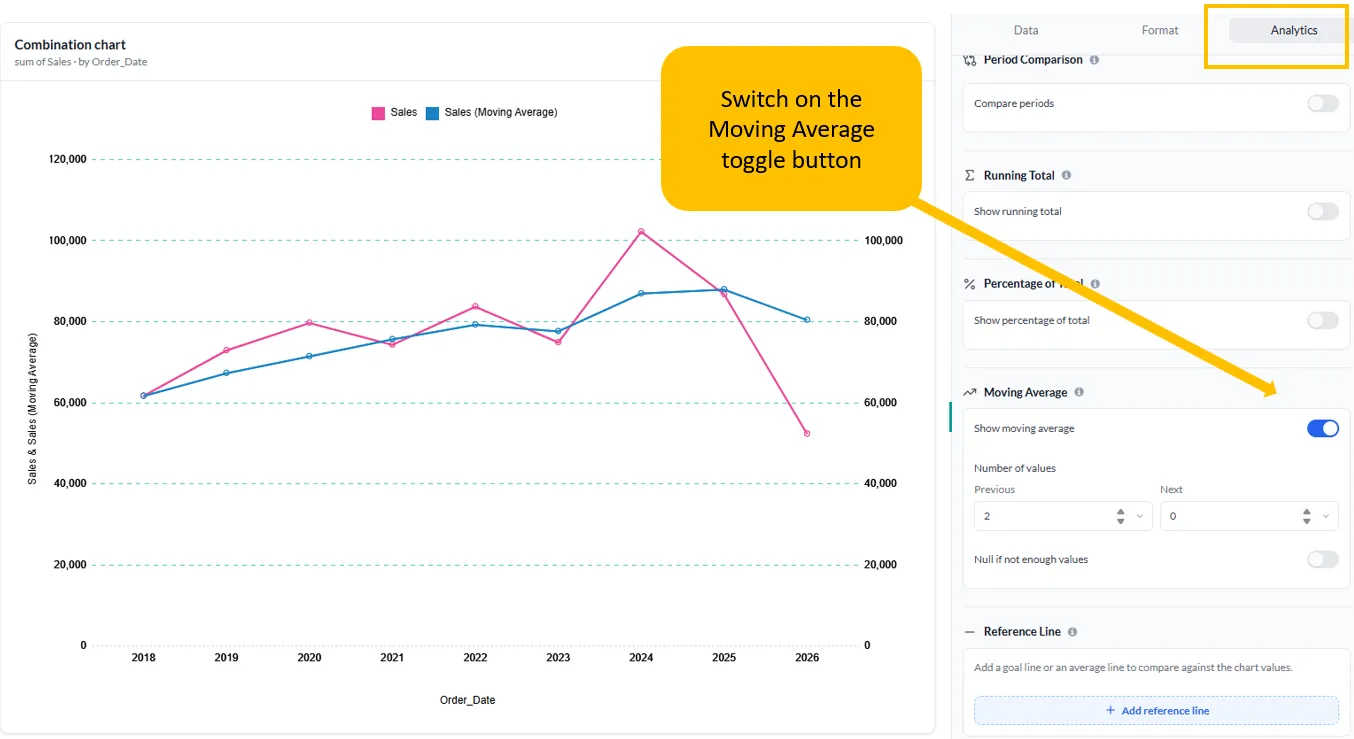
Configure the number of values
Section titled “Configure the number of values”The Previous and Next settings determine how many values are included in the moving average around the current data point.
Previous
Section titled “Previous”Previous specifies the number of values before the current value that should be included.
For example, with:
Previous = 2
Next = 0
the moving average uses the current value and the two preceding values.
For a sequence such as:
| Period | Value |
|---|---|
| Jan | 10 |
| Feb | 20 |
| Mar | 30 |
| Apr | 40 |
For March, the moving average uses:
Jan + Feb + Mar
So:
(10 + 20 + 30) ÷ 3 = 20
Next specifies the number of values after the current value that should be included. For example, with:
Previous = 1
Next = 1
uses one value before, the current value, and one value after.
For March:
Feb + Mar + Apr
The moving average is:
(20 + 30 + 40) ÷ 3 = 30
This creates a centered moving average because the calculation considers values on both sides of the current point.
Previous and Next together
Section titled “Previous and Next together”You can use both settings to control the size and position of the moving window. For example:
| Previous | Next | Values used |
|---|---|---|
| 2 | 0 | 2 previous + current |
| 1 | 0 | 1 previous + current |
| 1 | 1 | 1 previous + current + 1 next |
| 2 | 1 | 2 previous + current + 1 next |
| 0 | 2 | Current + 2 next |
Null if not enough values
Section titled “Null if not enough values”The Null if not enough values option controls what happens when there aren’t enough data points available to calculate the moving average.
This commonly occurs at the beginning or end of a series, depending on your Previous and Next settings.
Option enabled
Section titled “Option enabled”When Null if not enough values is enabled, the moving average is returned as null when the required number of values is not available.
For example, with:
Previous = 2 Next = 0
the first data point does not have two previous values. It therefore does not have enough values to calculate the moving average.
Option disabled
Section titled “Option disabled”When the option is disabled, the moving average can be calculated using the values that are available.
For example, at the beginning of a series, the calculation may use fewer values than the configured window.
Moving Average vs. original measure
Section titled “Moving Average vs. original measure”A moving average does not replace the underlying data conceptually; it provides a smoothed view of the measure.
For example:
| Month | Sales | Moving Average |
|---|---|---|
| Jan | €100K | €100K |
| Feb | €150K | €125K |
| Mar | €90K | €113K |
| Apr | €160K | €133K |
The original Sales values show the actual observations, while Moving Average shows the smoothed trend.
Viewing both together can help you identify whether individual increases or decreases are part of a broader trend.
When should you use a Moving Average?
Section titled “When should you use a Moving Average?”Use a moving average when you want to:
- Identify trends in time-series data more clearly.
- Reduce short-term fluctuations that may distract from the overall pattern.
- Smooth noisy data such as daily sales, website traffic, or stock prices.
- Compare actual values with a smoothed trend.
- Understand whether a metric is generally increasing, decreasing, or remaining stable.
For example, daily sales may fluctuate considerably:
€90K → €120K → €85K → €130K → €100K
A moving average smooths these fluctuations and makes the underlying sales trend easier to see.
When not to use it?
Section titled “When not to use it?”A moving average may not be appropriate when you need to see individual data points or sudden changes.
Because averaging smooths the data, short-term spikes and drops may become less prominent. If those changes are important to your analysis, consider showing the original measure alongside the moving average.
Tips for using Moving Average
Section titled “Tips for using Moving Average”- Use Moving Average primarily with ordered or time-series data, such as daily, weekly, or monthly values.
- Start with a small window when you want the smoothed line to remain responsive to recent changes.
- Increase the window when your data has a lot of short-term noise.
- Use Previous = 1 and Next = 1 for a simple centered three-value average.
- Use Previous = 2 and Next = 0 when you want the current value compared with its two preceding values.
- Consider keeping the original measure visible so you can compare actual values with the smoothed trend.
- Consider enabling Null if not enough values when you don’t want partial windows at the edges of the series.
- Remember that a moving average can make sudden changes less visible.